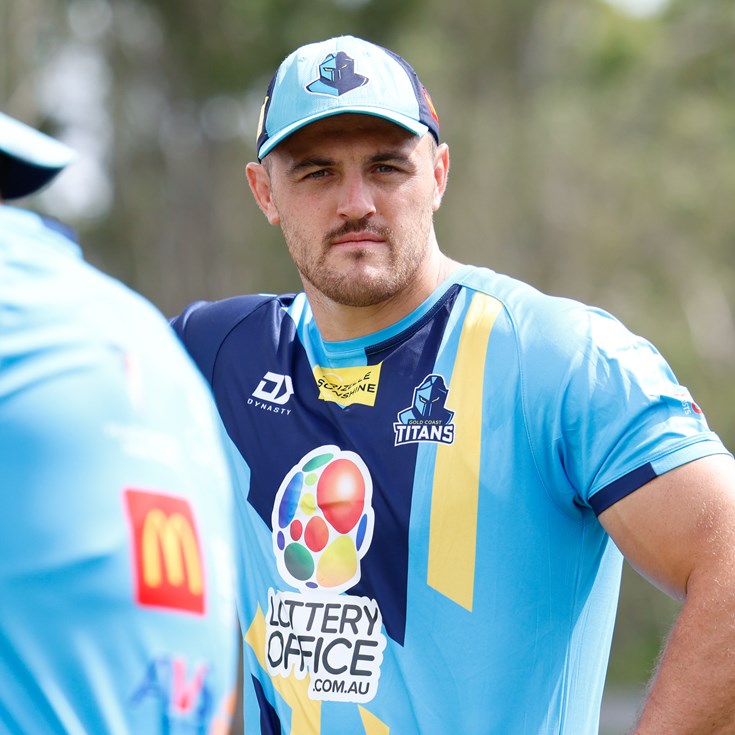
You have skipped the navigation, tab for page content
Phillip Sami
Winger
Player Bio
- Height:
- 186 cm
- Date of Birth:
- 02 August 1997
- Weight:
- 97 kg
- Birthplace:
- Ipswich, QLD
- Age:
- 27
- Nickname:
- Papi
- Debut Club:
- Gold Coast Titans
- Date:
- 16 June 2017
- Opposition:
- South Sydney Rabbitohs
- Round:
- 15
- Previous Club:
- -
- Junior Club:
- Goodna Eagles
Career
- Appearances
- 121
- Tries
- 56
2024 Season
- Appearances
- 13
Scoring
- Tries
- 5
Attack
- Try Assists
- 1
- Line Breaks
- 9
- Tackle Breaks
- 52
Passing
- Receipts
- 255
Defence
- Tackles Made
- 106
- Missed Tackles
- 21
- Tackle Efficiency
-
Running Metres
- Average Running Metres
- 176
- Total Running Metres
- 2288
Fantasy
- Total Points
- 520
- Average Points
- 40
2024 Season - By Round
Round | Opponent | Score | Position | Minutes Played | Tries | Goals | 1 Point Field Goals | 2 Point Field Goals | Points | Try Assists | Linebreaks | Tackle Breaks | Post Contact Metres | Offloads | Receipts | Tackles Made | Missed Tackles | Total Running Metres | Hit Up Running Metres | Kick Return Metres | |
---|---|---|---|---|---|---|---|---|---|---|---|---|---|---|---|---|---|---|---|---|---|
1 | Dragons | Lost | 4 - 28 | Winger | 80 | - | - | - | - | - | - | 1 | 10 | 71 | - | 16 | 3 | 1 | 162 | 8 | 3 |
3 | Bulldogs | Lost | 32 - 0 | Winger | 80 | - | - | - | - | - | - | - | 2 | 25 | - | 13 | 4 | 4 | 79 | 16 | 6 |
4 | Dolphins | Lost | 14 - 30 | Winger | 80 | 2 | - | - | - | 8 | - | 2 | 3 | 71 | - | 25 | 1 | 1 | 229 | 1 | 3 |
9 | Storm | Lost | 20 - 22 | Winger | 80 | 1 | - | - | - | 4 | - | 2 | 5 | 69 | - | 21 | 2 | 1 | 207 | 16 | 34 |
10 | Cowboys | Won | 20 - 18 | Winger | 26 | - | - | - | - | - | - | - | - | 18 | - | 9 | 1 | - | 54 | - | - |
15 | Wests Tigers | Lost | 18 - 10 | Centre | 80 | - | - | - | - | - | - | - | 6 | 61 | - | 21 | 25 | 1 | 148 | - | - |
16 | Warriors | Won | 66 - 6 | Winger | 80 | - | - | - | - | - | - | - | - | 59 | - | 19 | 1 | - | 187 | 20 | - |
19 | Eels | Won | 24 - 16 | Centre | 80 | 1 | - | - | - | 4 | - | 1 | 5 | 90 | - | 25 | 12 | 1 | 247 | 8 | - |
20 | Sea Eagles | Lost | 38 - 8 | Centre | 80 | - | - | - | - | - | - | 2 | 7 | 67 | 1 | 17 | 18 | 3 | 170 | - | - |
21 | Dolphins | Won | 14 - 21 | Centre | 80 | - | - | - | - | - | - | - | 6 | 83 | 4 | 27 | 6 | 3 | 238 | 9 | - |
22 | Broncos | Won | 46 - 18 | Centre | 80 | 1 | - | - | - | 4 | 1 | - | 2 | 54 | 2 | 24 | 11 | - | 181 | 10 | 4 |
23 | Sharks | Lost | 0 - 44 | Centre | 69 | - | - | - | - | - | - | - | 5 | 40 | - | 14 | 9 | 3 | 126 | - | - |
24 | Dragons | Lost | 32 - 16 | Centre | 80 | - | - | - | - | - | - | 1 | 1 | 95 | 1 | 24 | 13 | 3 | 255 | 22 | - |
Career By Season
Year | Played | Won | Lost | Drawn | Win % | Tries | Goals | 1 Point Field Goals | 2 Point Field Goals | Points | Kicking Metres | Kicking Metres Average | Goal Conversion Rate | Forced Drop Outs | Try Assists | Linebreaks | Receipts | Tackles Made | Missed Tackles | Tackle Efficiency | Total Running Metres | Average Running Metres | Kick Return Metres | Total Points | Average Points | |
---|---|---|---|---|---|---|---|---|---|---|---|---|---|---|---|---|---|---|---|---|---|---|---|---|---|---|
Titans | 2017 | 4 | - | 4 | - | - | 1 | - | - | - | 4 | 2 | 0.63 | - | - | - | 1 | 64 | 29 | 2 | 93.55% | 451 | 112.00 | - | 95 | 23.8 |
Titans | 2018 | 23 | 8 | 15 | - | 35% | 14 | - | - | - | 56 | 56 | 2.46 | - | 1 | 1 | 13 | 431 | 70 | 16 | 81.40% | 3,019 | 131.00 | 375 | 728 | 31.6 |
Titans | 2019 | 15 | 1 | 14 | - | 7% | 6 | - | - | - | 24 | 117 | 7.81 | - | 2 | 1 | 8 | 257 | 47 | 13 | 78.33% | 1,799 | 119.00 | 300 | 495 | 33.0 |
Titans | 2020 | 13 | 4 | 9 | - | 31% | 7 | - | - | - | 28 | 6 | 0.45 | - | - | - | 7 | 242 | 63 | 15 | 80.77% | 1,610 | 123.00 | 345 | 444 | 34.2 |
Titans | 2021 | 18 | 7 | 11 | - | 39% | 6 | - | - | - | 24 | 54 | 3.01 | - | 1 | 2 | 10 | 295 | 70 | 13 | 84.34% | 2,498 | 138.00 | 212 | 574 | 31.9 |
Titans | 2022 | 14 | 4 | 10 | - | 29% | 6 | - | - | - | 24 | - | - | - | - | 2 | 6 | 213 | 133 | 18 | 88.08% | 1,704 | 121.00 | 67 | 467 | 33.4 |
Titans | 2023 | 21 | 8 | 13 | - | 38% | 11 | - | - | - | 44 | 29 | 1.37 | - | - | 2 | 13 | 442 | 82 | 19 | 81.19% | 3,611 | 171.00 | 299 | 783 | 37.3 |
Titans | 2024 | 13 | 5 | 8 | - | 38% | 5 | - | - | - | 20 | - | - | - | - | 1 | 9 | 255 | 106 | 21 | 83.46% | 2,288 | 176.00 | 51 | 520 | 40.0 |
Career Overall
Year Start | Year End | Played | Won | Lost | Drawn | Win % | Tries | Goals | 1 Point Field Goals | 2 Point Field Goals | Points | Kicking Metres | Kicking Metres Average | Goal Conversion Rate | Forced Drop Outs | Try Assists | Linebreaks | Receipts | Tackles Made | Missed Tackles | Tackle Efficiency | Total Running Metres | Average Running Metres | Kick Return Metres | Total Points | Average Points | |
---|---|---|---|---|---|---|---|---|---|---|---|---|---|---|---|---|---|---|---|---|---|---|---|---|---|---|---|
Titans | 2017 | 2024 | 121 | 37 | 84 | - | 31% | 56 | - | - | - | 224 | 265 | 2.14 | - | 4 | 9 | 67 | 2,198 | 600 | 117 | 83.68% | 16,951 | 136.00 | 1,651 | 4,103 | 33.9 |
Latest
Team Mates
Gold Coast Titans proudly acknowledges the Traditional Custodians of the land on which we are situated, the Kombumerri families of the Yugambeh Language Region. We pay our respects to their Elders past, present and emerging, and recognise their continuing connections to the lands, waters and their extended communities throughout South East Queensland.