You have skipped the navigation, tab for page content
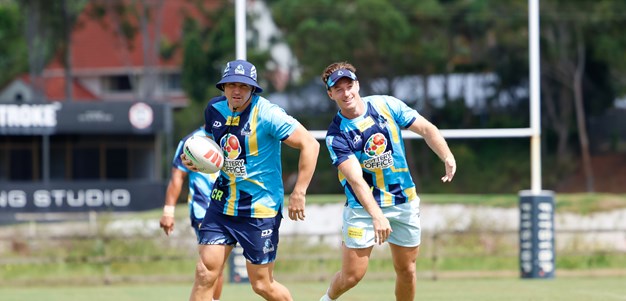
Sam Verrills Profile Image

Sam Verrills

Hooker

Titans

Player Bio

Height:
183 cm
Date of Birth:
13 January 1999
Weight:
88 kg
Birthplace:
Sydney, NSW
Age:
26
Nickname:
Vez
Debut Club:
Sydney Roosters
Date:
19 April 2019
Opposition:
Melbourne Storm
Round:
6
Previous Club:
Sydney Roosters
Junior Club:
-

Career

Appearances
89
Tries
9

2025 Season

Appearances
6

Scoring

Tries
0

Kicking

Forced Drop Outs
0
Average Kicking Metres
8.7

Attack

Try Assists
2
Line Break Assists
3

Passing

Offloads
4
Receipts
552

Defence

Tackles Made
231
Tackle Efficiency

Tackle Efficiency 93.2%

Running Metres

Average Running Metres
29
Total Running Metres
176

Fantasy

Total Points
243
Average Points
40.5

2025 Season - By Round

Round Opponent Score Position Minutes Played Tries Goals 1 Point Field Goals 2 Point Field Goals Points Kicking Metres Try Assists Linebreaks Tackle Breaks Post Contact Metres Offloads Receipts Tackles Made Missed Tackles Total Running Metres Hit Up Running Metres Kick Return Metres
2 Bulldogs Lost 40 - 24 Hooker 80 - - - - - 2 - - - 10 1 104 36 2 31 - -
3 Knights Won 26 - 6 Hooker 72 - - - - - 50 - - - 3 - 101 41 3 10 - -
4 Roosters Won 12 - 30 Hooker 62 - - - - - - 2 - 1 6 1 88 32 4 35 - -
6 Dragons Lost 38 - 16 Hooker 71 - - - - - - - - - 3 1 87 37 3 18 8 -
7 Raiders Lost 20 - 30 Hooker 74 - - - - - - - - - 16 - 78 41 2 42 - -
8 Cowboys Lost 50 - 18 Hooker 69 - - - - - - - - - 10 1 94 44 3 38 - -

Career By Season

Career By Season
Year Played Won Lost Drawn Win % Tries Goals 1 Point Field Goals 2 Point Field Goals Points Kicking Metres Kicking Metres Average Goal Conversion Rate Forced Drop Outs Try Assists Offloads Receipts Tackles Made Missed Tackles Tackle Efficiency Total Running Metres Average Running Metres Kick Return Metres Total Points Average Points
Roosters 2019 14 12 2 - 86% 3 - - - 12 35 2.53 - - 3 1 1,095 459 34 93.10% 482 34.00 - 514 36.7
Roosters 2020 5 3 2 - 60% - - - - - 2 0.48 - - - 2 135 70 7 90.91% 63 12.00 - 63 12.6
Roosters 2021 14 10 4 - 71% 1 - - - 4 66 4.74 - 1 4 1 1,230 511 33 93.93% 352 25.00 5 517 36.9
Roosters 2022 15 10 5 - 67% 3 - - - 12 7 0.47 - - 3 6 1,346 558 25 95.71% 577 38.00 1 654 43.6
Titans 2023 11 4 7 - 36% 1 - - - 4 20 1.84 - - 4 1 934 407 35 92.08% 437 39.00 3 441 40.1
Titans 2024 24 8 16 - 33% 1 - - - 4 29 1.20 - 2 3 1 1,806 872 74 92.18% 909 37.00 - 890 37.1
Titans 2025 6 2 4 - 33% - - - - - 52 8.73 - - 2 4 552 231 17 93.15% 176 29.00 - 243 40.5

Career Overall

Career Overall
Year Start Year End Played Won Lost Drawn Win % Tries Goals 1 Point Field Goals 2 Point Field Goals Points Kicking Metres Kicking Metres Average Goal Conversion Rate Forced Drop Outs Try Assists Offloads Receipts Tackles Made Missed Tackles Tackle Efficiency Total Running Metres Average Running Metres Kick Return Metres Total Points Average Points
Roosters 2019 2022 48 35 13 - 73% 7 - - - 28 111 2.31 - 1 10 10 3,806 1,598 99 94.17% 1,475 30.00 6 1,748 36.4
Titans 2023 2025 41 14 27 - 34% 2 - - - 8 102 2.48 - 2 9 6 3,292 1,510 126 92.30% 1,523 37.00 3 1,574 38.4

Latest

Team Mates

Acknowledgement of Country

Gold Coast Titans proudly acknowledges the Traditional Custodians of the land on which we are situated, the Kombumerri families of the Yugambeh Language Region. We pay our respects to their Elders past, present and emerging, and recognise their continuing connections to the lands, waters and their extended communities throughout South East Queensland.